DEMO: basisChebyshev
This script provides a few examples on using the basis class.
Last updated: October 4, 2014.
Copyright (C) 2014 Randall Romero-Aguilar
Licensed under the MIT license, see LICENSE.txt
Contents
EXAMPLE 1: Using basisChebyshev to interpolate a 1-D function with a Chebyshev basis
PROBLEM: Interpolate the function y = f(x) = 1 + sin(2*x) on the domain [0,pi], using 5 Gaussian nodes.
- First, create the function f
f = @(x) 1 + sin(2*x);
- and the Chebyshev basis B. If the type of nodes is unspecified, Gaussian is computed by default
B = basisChebyshev(5,0,pi)
Chebyshev Basis of one dimension with gaussian nodes

	    Variable           # of nodes       Interval
	V0                         5        [  0.00,   3.14]
Interpolation matrix and nodes
- Obtain the interpolation matrix Phi, evaluated at the basis nodes.
Phi = B.Interpolation
Phi =

    1.0000   -0.9511    0.8090   -0.5878    0.3090
    1.0000   -0.5878   -0.3090    0.9511   -0.8090
    1.0000         0   -1.0000         0    1.0000
    1.0000    0.5878   -0.3090   -0.9511   -0.8090
    1.0000    0.9511    0.8090    0.5878    0.3090
- The basis nodes are:
xnodes = B.nodes
xnodes =

    0.0769
    0.6475
    1.5708
    2.4941
    3.0647
Fitting a function
- To set the interpolation coefficients c:
c = Phi\f(xnodes)
or simply
c = B.Interpolation\f(B.nodes)
c =

    1.0000
   -0.5690
   -0.0000
    0.6601
    0.0000
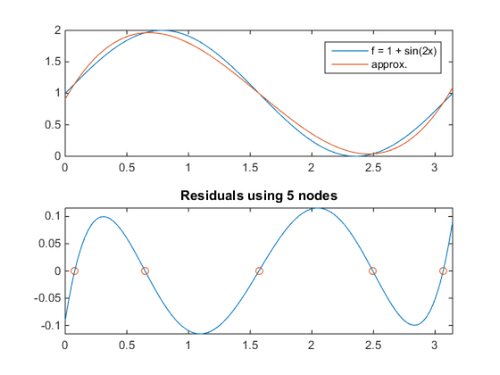
Next plot the function f and its approximation. To evaluate the function defined by the basis B and coefficients c at values xx we use the Interpolate method:
y_approx = B.Interpolate(c,xx)
We also plot the residuals, showing the residuals at the interpolating nodes (zero by construction)
xx = linspace(B.a,B.b,121)';
figure
subplot(2,1,1), plot(xx,[f(xx), B.Interpolate(c,xx)])
axis tight
legend('f = 1 + sin(2x)','approx.')

subplot(2,1,2), plot(xx, B.Interpolate(c,xx) - f(xx))
title('Residuals using 5 nodes'), axis tight
hold on, plot(B.nodes,f(B.nodes) - B.Interpolate(c),'o')

Adjusting the number of nodes
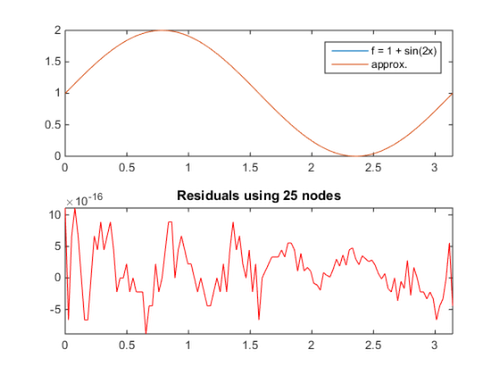
To increase accuracy, we increase the number of nodes in B to 25.
B.n = 25;
c2 = B.Interpolation\f(B.nodes);
figure
subplot(2,1,1), plot(xx,[f(xx), B.Interpolate(c2,xx)])
axis tight
legend('f = 1 + sin(2x)','approx.')

subplot(2,1,2), plot(xx, B.Interpolate(c2,xx) - f(xx),'r')
title('Residuals using 25 nodes'), axis tight
